Keynesian Approach of Quantity Theory of Money
Why this theory came-up
- No direct relationship between quantity of money and prices
- Effect of change in quantity of money
- Integrated value theory with monetary theory
- Money isn’t neutral
Keynesian Approach
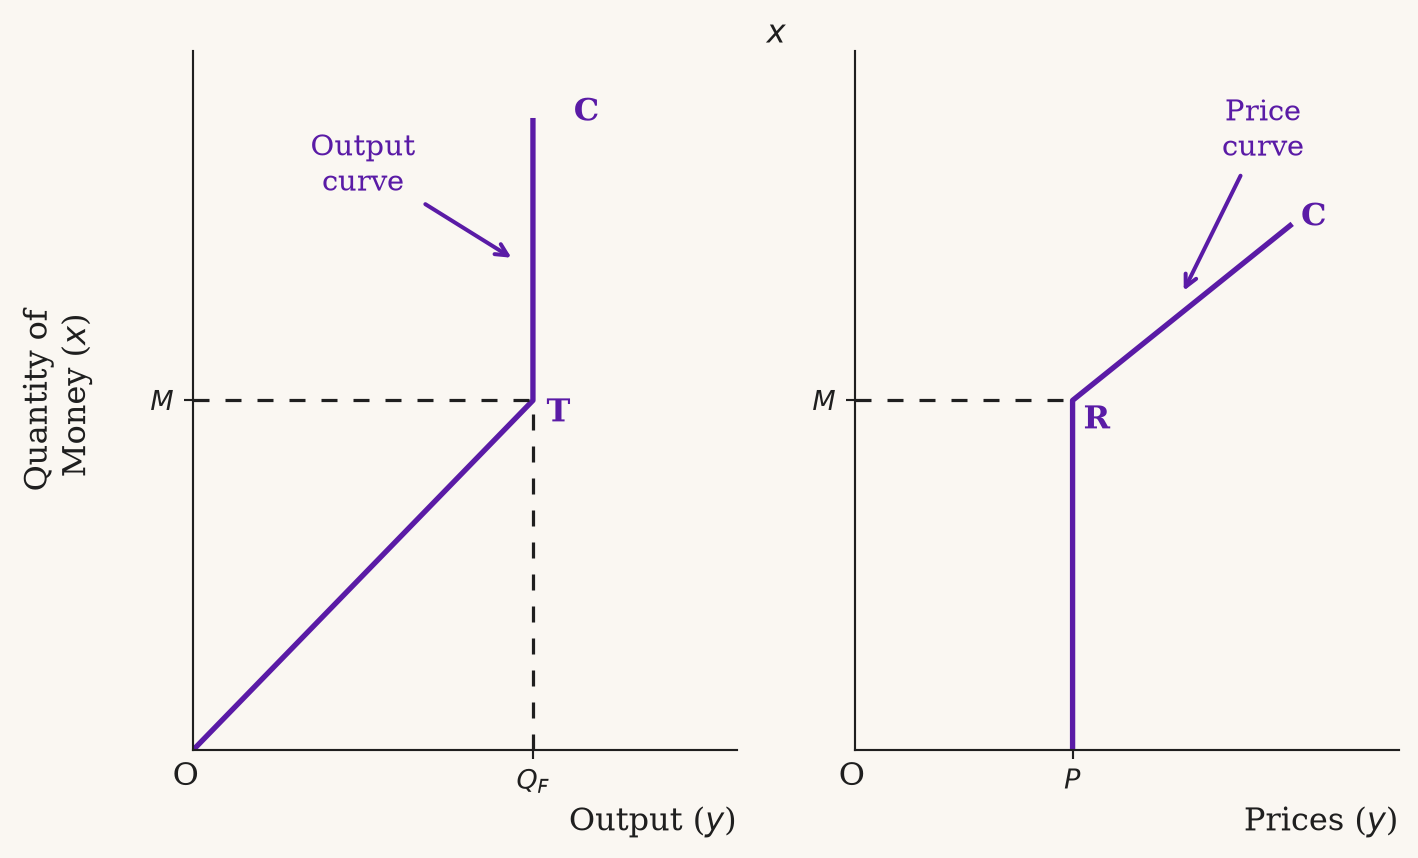
- So long as there is unemployment, output changes in the same proportion as quantity of money.
- When there is full employment, then price changes in the same proportion as quantity of money.
Assumptions
- All factors are perfectly elastic, so long as there is unemployment.
- All unemployed factors are homogeneous and perfectly divisible.
- Constant returns to scale. When there is increase in output prices does not change.
- Effective demand and quantity of money change in the same proportion as long as there is unemployment in the economy.
Theory
- According to Keynes, there is indirect relationship between change in quantity of money and price i.e., via Rate of Interest \((i)\).
NoteImportant to Understand
Money Supply \((\uparrow)\) \(\rightarrow\) \((i) \downarrow\) \(\rightarrow\) Investment \((I \uparrow)\) \(\rightarrow\) Effective Demand \((\uparrow)\) \(\rightarrow\) Increases income, output and employment
- Prices will not change with change in output till full employment in the economy.
- Once we reach full employment level prices will increase in the same proportion with the level of output.
Demand for money for Three Motives
- Liquidity Preference means the demand of a person to hold cash.
- We demand for money for three motives:
- Transaction
- Precaution
- Speculation
Transaction Motive
- Day-to-day transactions
- Medium of Exchange
- It depends on Level of income
- More demand when Price Level increases
- Certainty of Income
Precaution Motive
- Unforeseen contingencies
- Depends on level of income
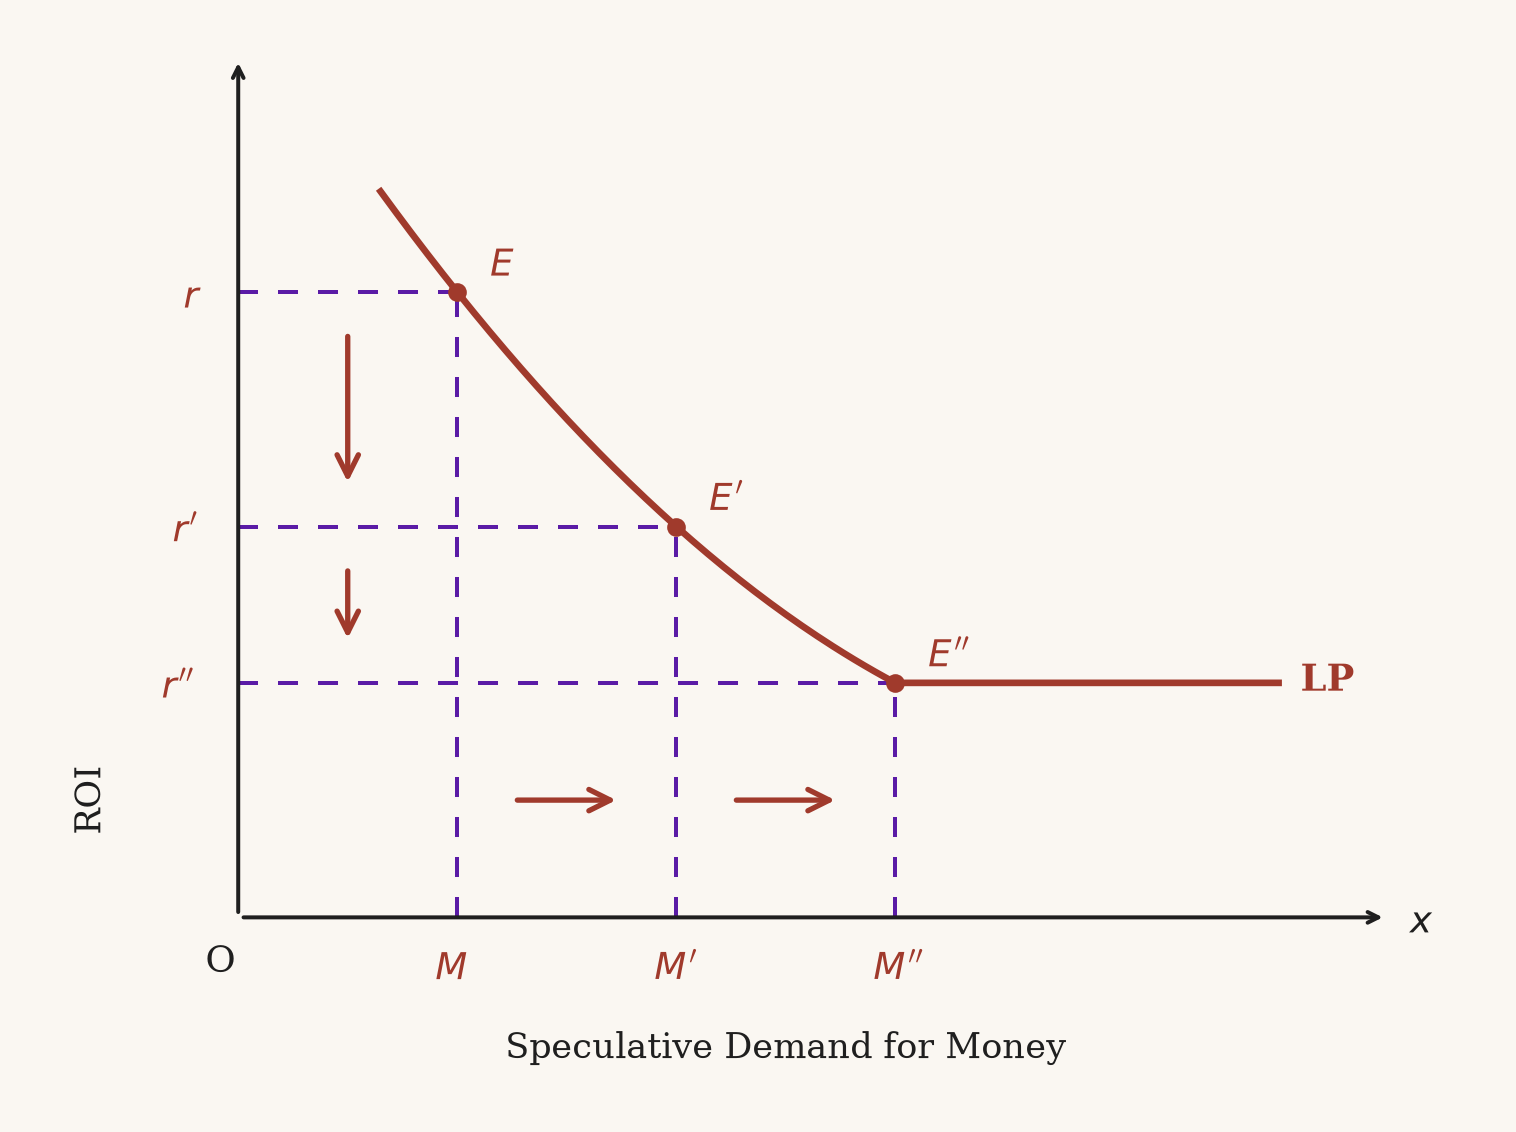
Speculative Motive
- Desire to hold wealth to take advantage of market movements
- Share, debentures, we get interest \((i)\)
- Rate of interest is the dominant factor